As you can check in this SE post, subplot is not working for more then 9 plots, for nrows = 4. Here is a sample code:
library(plotly)
p <- plot_ly(economics, x = date, y = uempmed)
qtySubPlots <- 10
options <- list(nrows=4)
plots <- lapply(seq(1,qtySubPlots), function(x) {p})
do.call(subplot, c(plots,options))
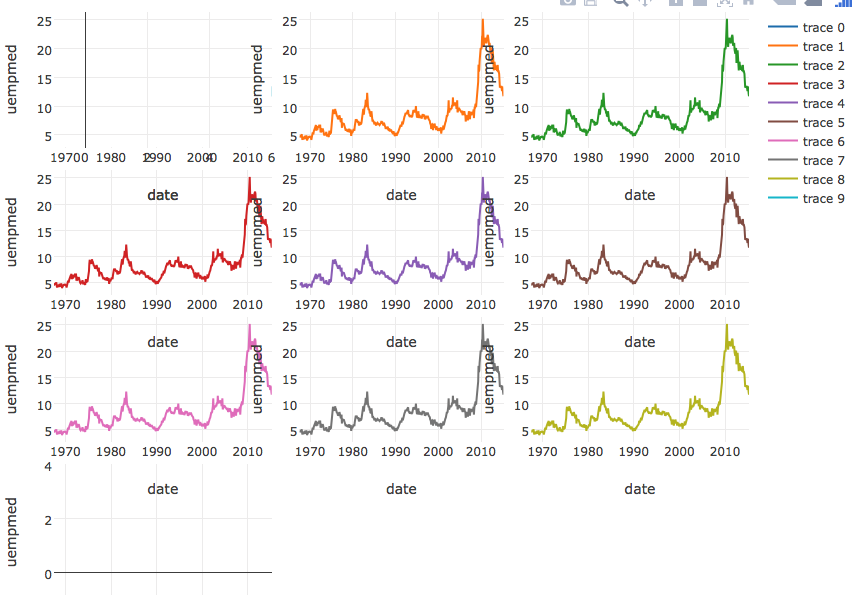
Other nrows combinations have the same problem.
As you can check in this SE post,
subplotis not working for more then 9 plots, fornrows = 4. Here is a sample code:Other
nrowscombinations have the same problem.